Dashboard Analytics
Visual Insights into School Performance and Operations
The Dashboard Analytics module in iQuest Analytics provides a comprehensive, real-time overview of key school metrics through interactive charts, graphs, and reports. This feature enables school administrators, teachers, and stakeholders to make data-driven decisions by monitoring academic performance, student engagement, financial status, and overall school operations at a glance.
1. Key Performance Indicators (KPIs)
The dashboard displays critical metrics to assess the institution’s overall health and performance, including:
- Student Enrollment Trends – Visual representation of student admission and dropout rates.
- Attendance Analytics – Daily, weekly, and monthly attendance statistics for students and staff.
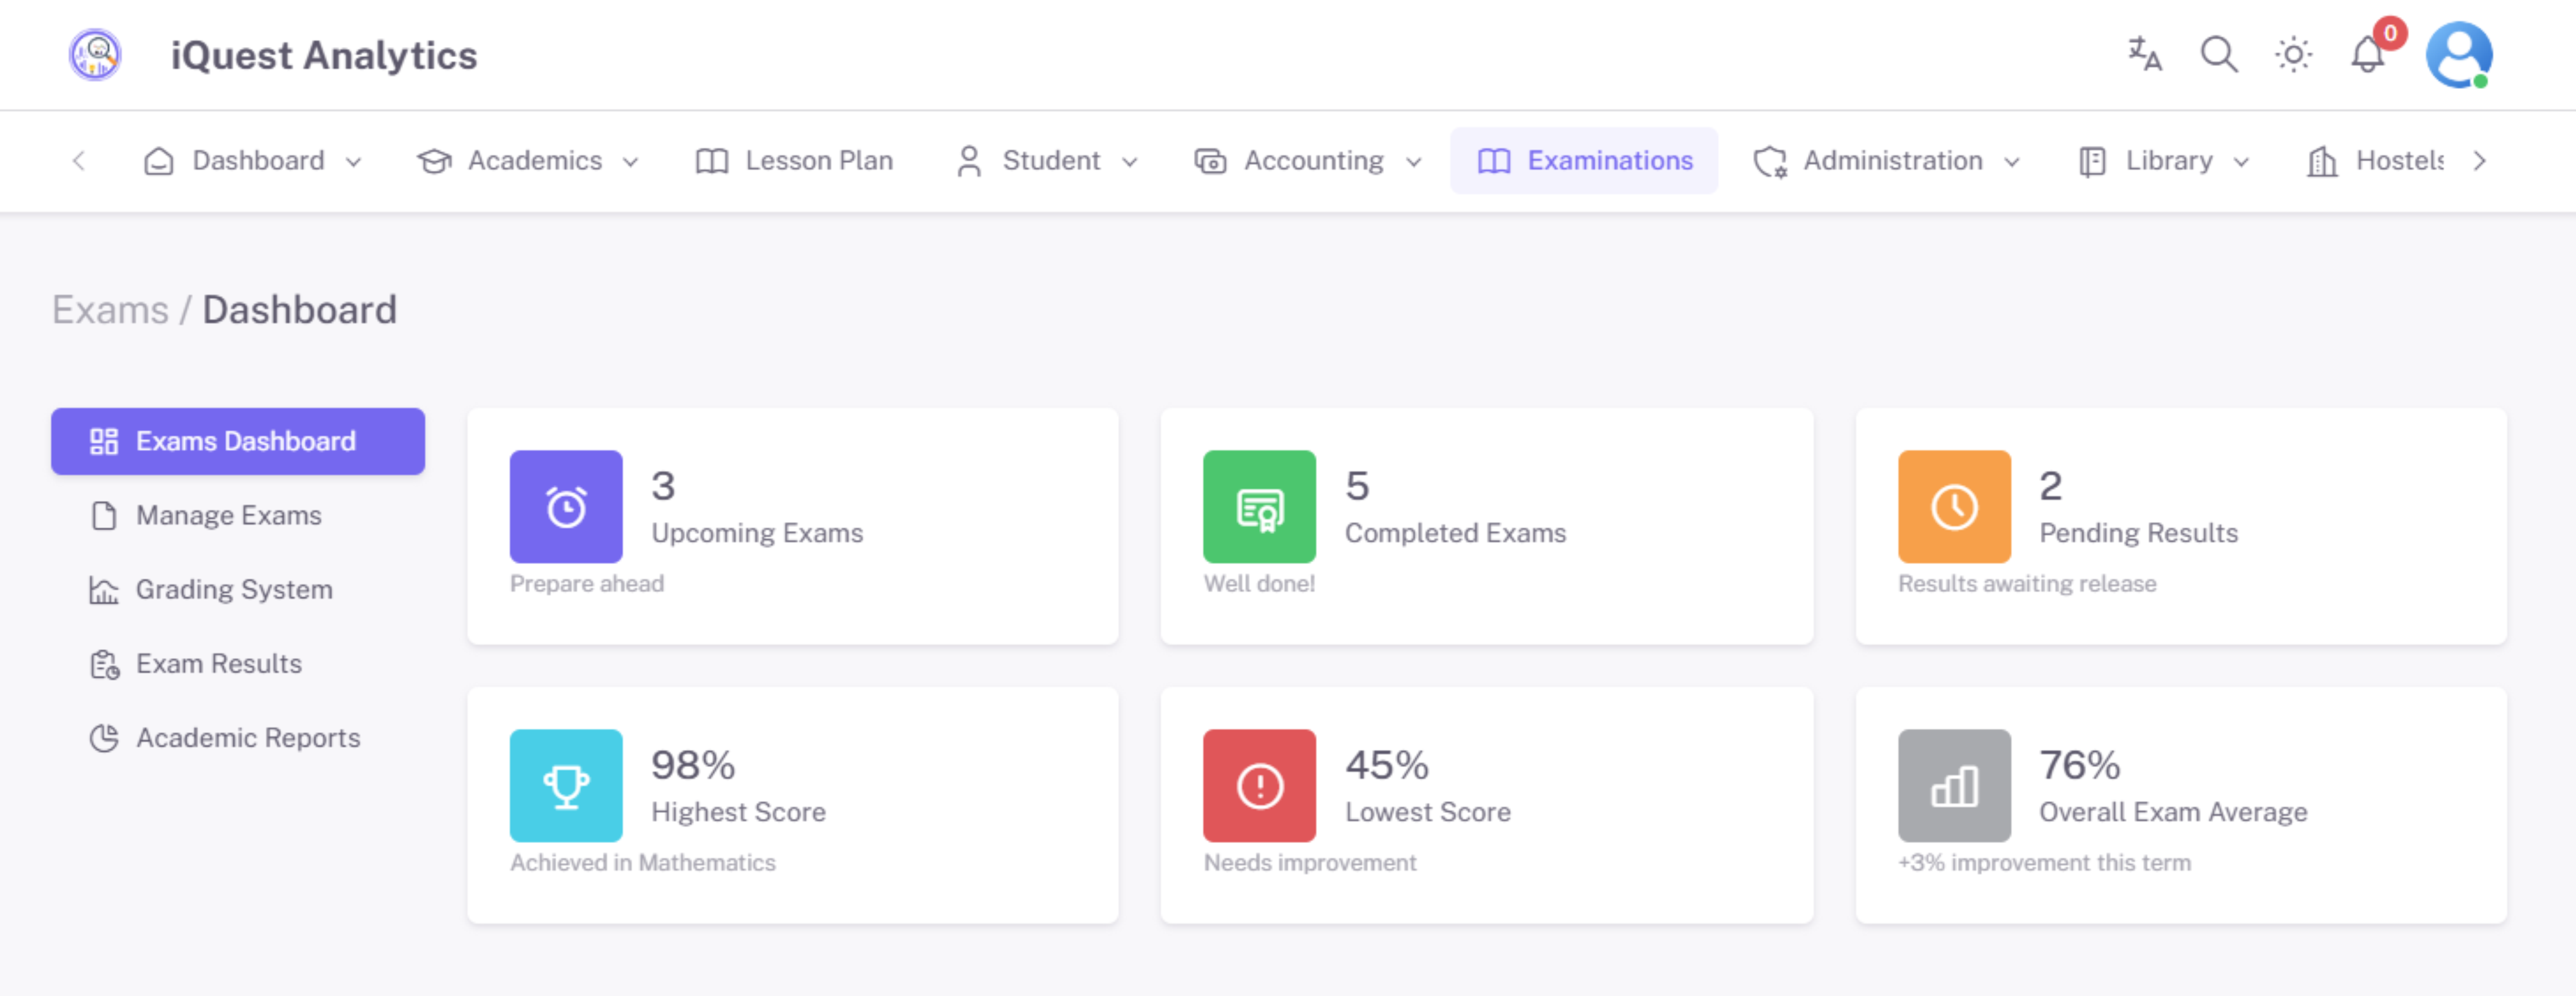
- Exam Performance Summary – Subject-wise and grade-wise student performance analysis.
- Fee Collection & Outstanding Payments – Real-time tracking of paid, pending, and overdue fees.
- Teacher & Staff Performance – Evaluation based on student feedback, attendance, and teaching effectiveness.
- Library Usage & Resources – Insights into book checkouts, returns, and digital resource consumption.
2. Data Visualization & Interactive Reports
The dashboard provides intuitive visual analytics through:
- Pie Charts & Bar Graphs – Breakdown of student demographics, fee collection, and exam results.
- Line Graphs – Trends in attendance, enrollment, and academic progress over time.
- Heatmaps – Identify peak engagement times and areas needing improvement.
- Comparative Analysis Tools – Compare performance across different academic years, classes, or subjects.
3. Student Performance Analytics
- Grade Distribution Reports – Identify academic strengths and weaknesses.
- Top & Bottom Performing Students – Recognition of top achievers and intervention for struggling students.
- Subject-Wise Performance Trends – Assess how students perform in different subjects over time.
- AI-Driven Predictions – Forecast future academic outcomes based on historical data.
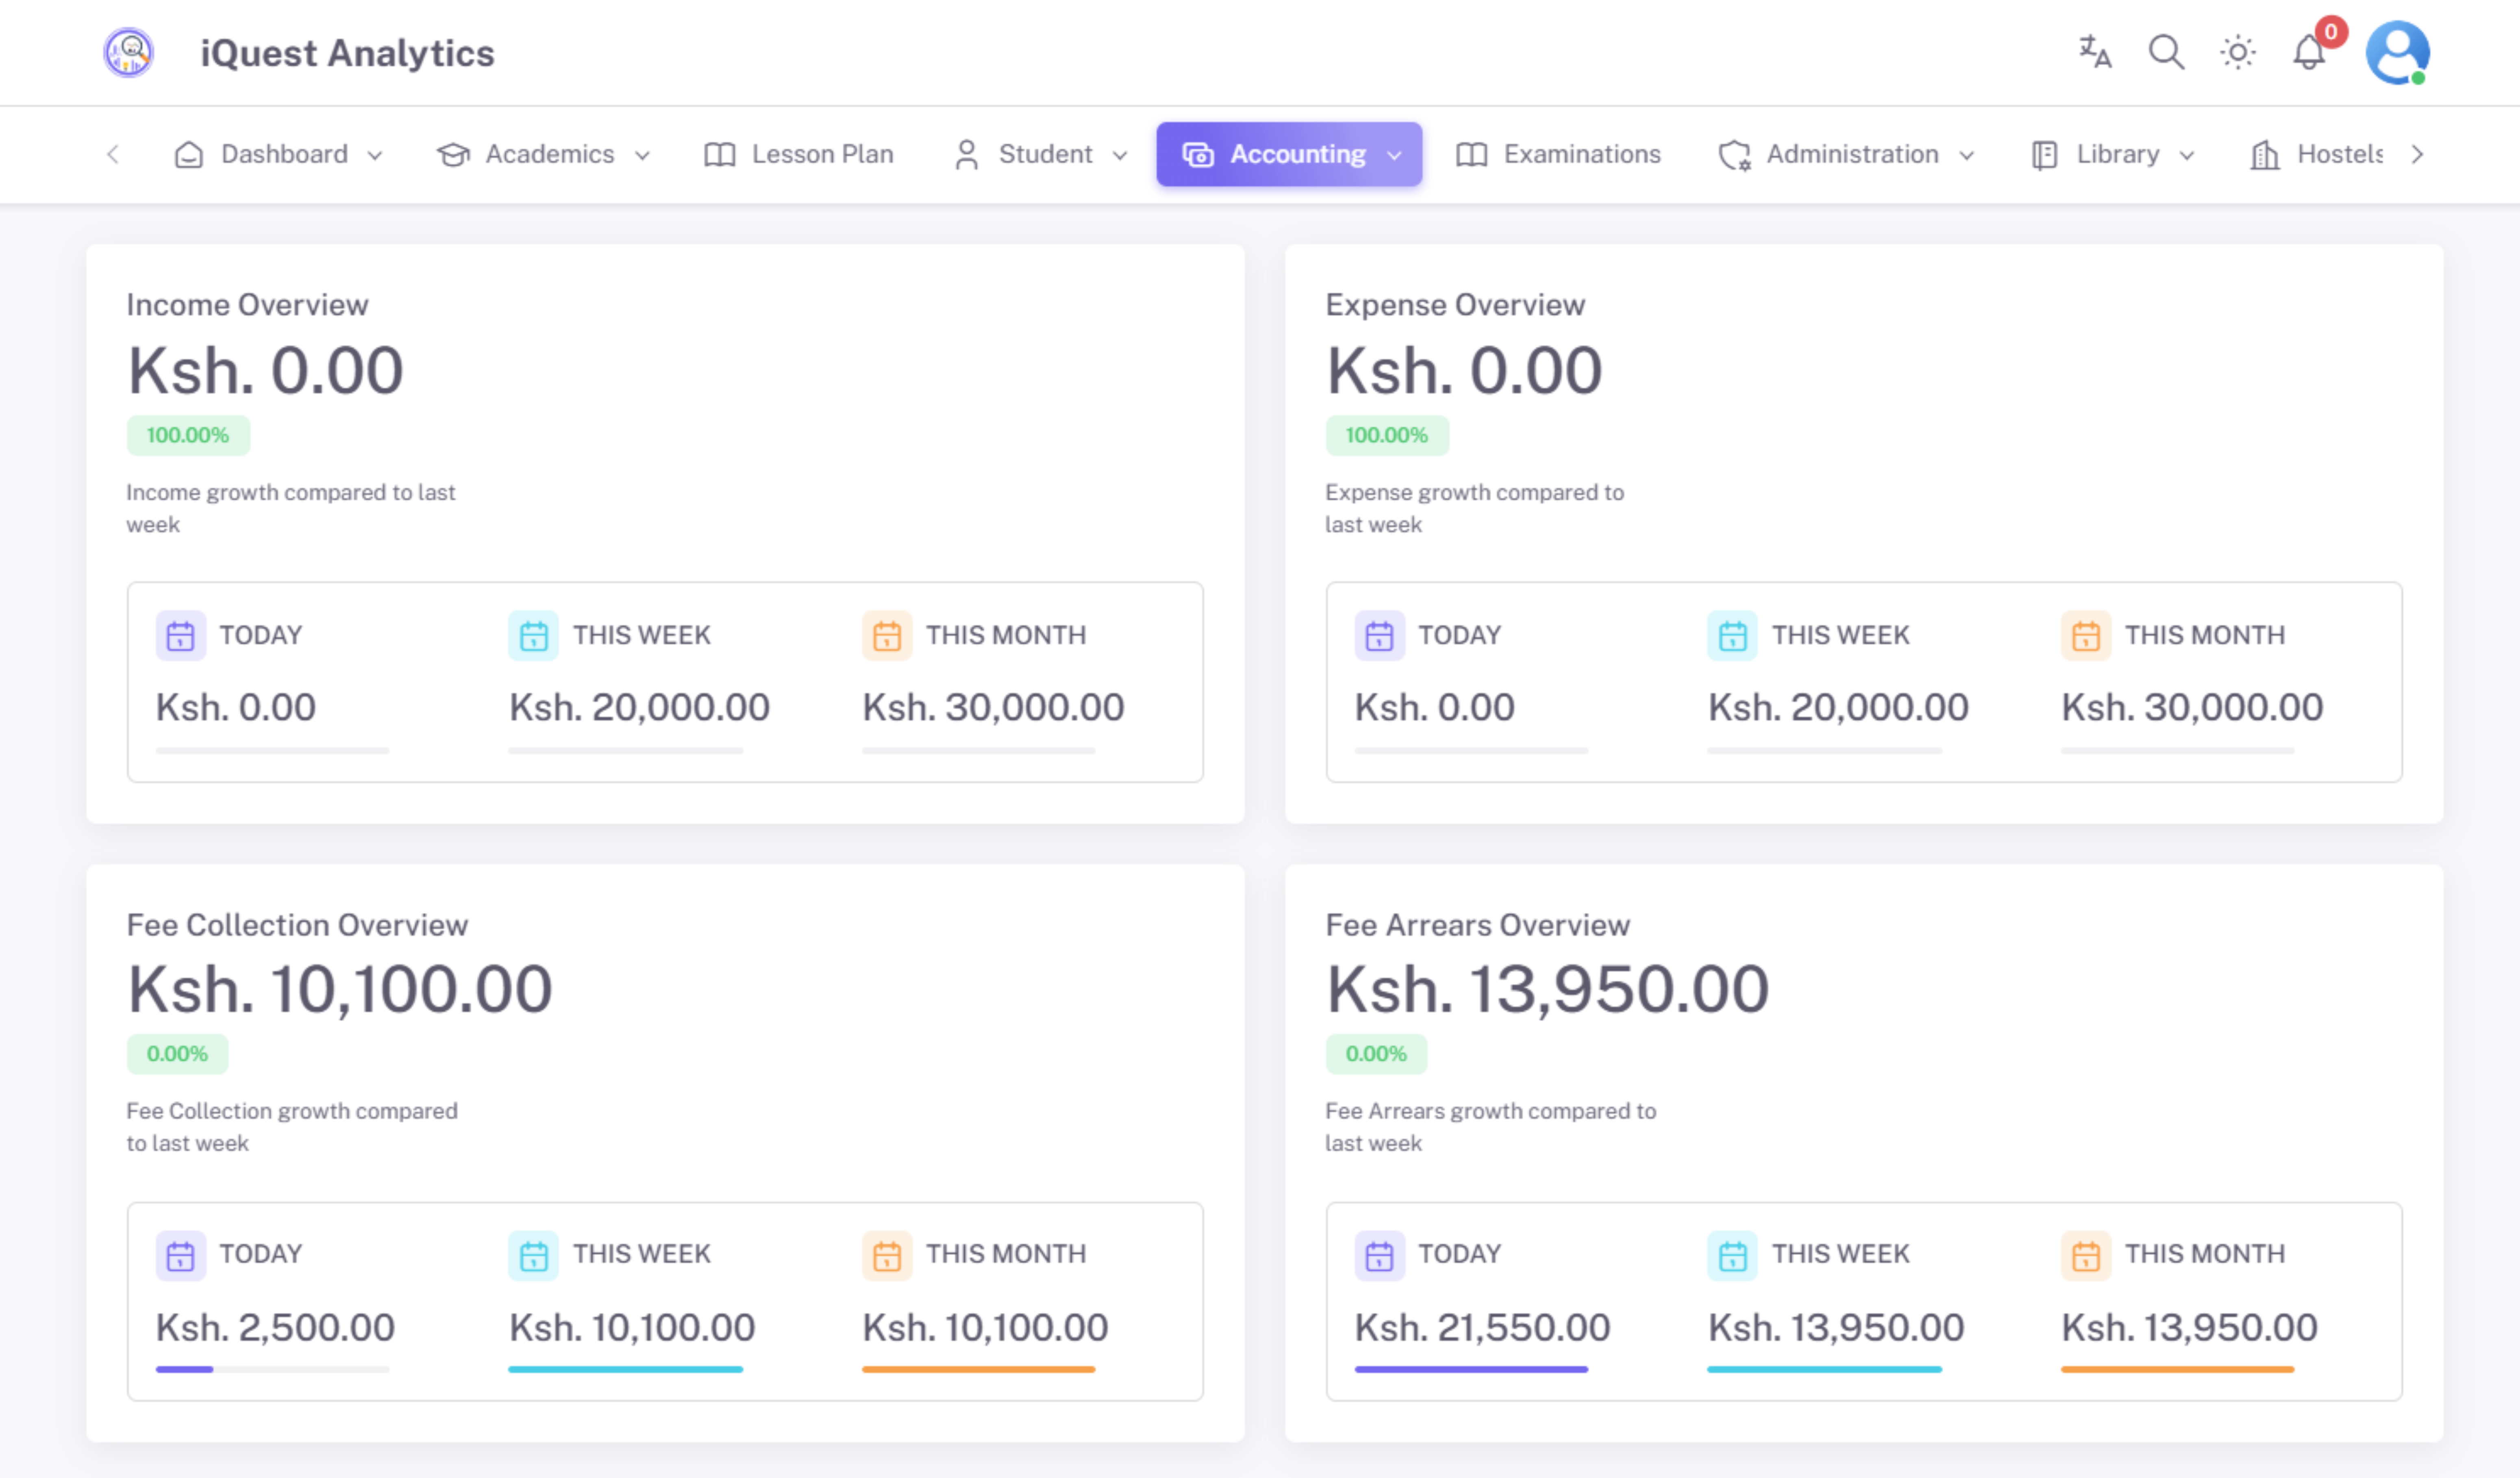
4. Financial Insights
- Revenue Breakdown – Track income from tuition fees, donations, and other sources.
- Expense Monitoring – Analyze school spending on infrastructure, salaries, and resources.
- Pending Fees & Defaulters – Identify students with outstanding payments and send automated reminders.
- Payment Gateway Integrations – Monitor transactions made through M-Pesa, PayPal, bank transfers, and credit cards.
5. Attendance & Discipline Monitoring
- Real-Time Attendance Tracking – View absences, tardiness, and trends in student attendance.
- Behavior & Discipline Reports – Track incidents, interventions, and improvements.
- Student Engagement Metrics – Measure participation in extracurricular activities and assignments.
6. Customizable & Role-Based Access
- Administrator Dashboard – High-level school operations overview.
- Teacher Dashboard – Class performance, assignments, and attendance.
- Student Dashboard – Personal progress, assignments, and grades.
- Parent Dashboard – Child’s academic and attendance insights.
7. Alerts & Notifications
- Automated Alerts – Notify parents, students, and staff about fees, attendance, and upcoming exams.
- Email & SMS Integration – Ensure timely communication of critical information.
8. Key Benefits
✔ Real-Time Insights – Get instant access to vital school performance data.
✔ Data-Driven Decisions – Helps administrators and educators make informed choices.
✔ Efficiency & Transparency – Reduces manual reporting and improves operational clarity.
✔ Improved Academic Performance – Identifies struggling students early for intervention.
The Dashboard Analytics in iQuest Analytics transforms school data into actionable insights, enhancing decision-making, improving academic performance, and optimizing school operations through visual intelligence and automated reporting.